Mastering Data Enrichment Techniques: Boost Your Data Quality in 2024

Did you know that poor data quality costs businesses an average of $12.9 million annually?
That’s a staggering figure! But fear not, because data enrichment is here to save the day.
In this guide, we’ll dive into the world of data enrichment techniques that can transform your raw data into a powerhouse of insights.
Whether you’re a data analyst, business owner, or just data-curious, these techniques will help you supercharge your data quality for 2024 and beyond!
Key Takeaways
- Data enrichment is crucial to improve data quality and gain valuable insights. It involves enhancing raw data with additional information from various sources to gain a competitive edge, understand customers, and make faster decisions.
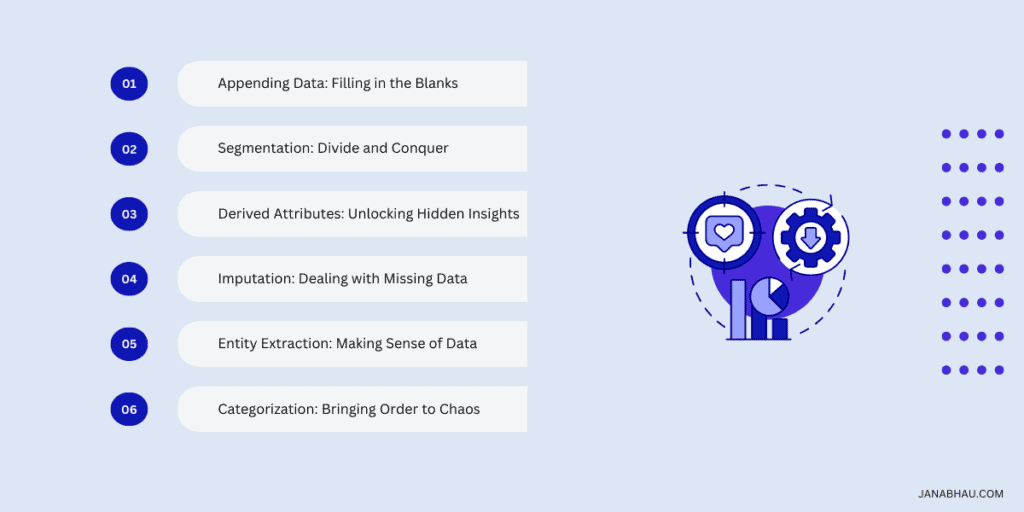
- The six main data enrichment techniques are: data appending, segmentation, derived attributes, imputation, entity extraction, and categorization.
- It is important to implement these data enrichment techniques judiciously with sufficient human oversight to improve data quality and business outcomes.
What is Data Enrichment?
Data enrichment is the process of enhancing, refining, or improving raw data by combining it with relevant information from other sources. By adding more information from external data sources such as social media platforms, web scraping, public records, etc. you can fortify your existing data and derive better insights to understand your customer better.
In simple terms, it’s like giving your data a superpower boost!
How is Data Enrichment Different from Data Cleansing?
Data enrichment isn’t about making your data look pretty; it’s about making it work harder for you. So, it shouldn’t be confused with data cleansing, which is more like giving your data a good scrub.
While data cleansing focuses on correcting or removing inaccurate records, data enrichment is all about adding valuable context and depth to your existing data.
Think of it as the difference between washing your car and giving it a full upgrade with a new stereo system and GPS. And let me tell you, the impact of high-quality, enriched data on business decisions is huge. I’ve seen companies completely transform their strategies once they started working with enriched data and data enrichment tools.
Enriching your data will help your business spot market trends faster and make decisions with more confidence. In today’s data-driven world, enriched data isn’t just nice to have, it is essential for staying competitive and making smart moves.
Reasons You Need to Know Data Data Enrichment
Why should you care about data enrichment? Let me tell you, it’s not just some fancy tech jargon – it’s a total game-changer. I learned this the hard way after years of fumbling around with incomplete data.

1. Customer Insights
Data enrichment enhances your understanding of customers by filling in gaps with additional demographic, behavioral, and psychographic information. Companies that make decisions based on enriched customer data improve their marketing return on investment (MROI) by 15-20%!
I remember the first time we enriched our customer data, we could suddenly predict what customers wanted before they even knew it. With this information, we could build detailed Ideal Customer Profiles (ICPs) and tailor our offerings to suit them.
2. Smarter Decision Making
With enriched data there are no more guessing games—you’re making moves based on solid intel. I’ve witnessed businesses leapfrog their competition simply by utilizing their data more effectively.
For instance, enriched data can reveal patterns in customer behavior that you may not have noticed before. By analyzing and combining different types of data you can enhance operational efficiency and find a better product alignment.
3. Competitive Edge
In today’s cutthroat market, you need every advantage you can get. Enriched data gives you that edge. You can leverage demographic data and trends to understand better, or even innovate a new product based on changing demands.
Enriched data helps your business react to your customer’s needs and wants in a proactive manner, ensuring that you always stay ahead of the curve.
4. Time Saver
I can’t tell you how many hours I used to waste trying to piece together information from various sources. It was a tedious and inefficient process! With enriched data, everything you need is right at your fingertips, streamlining decision-making and boosting productivity.
You can consider creating an automated flow for data collection and consolidate all the details in a single view for faster decision making.
5. Better Marketing
We saw our conversion rates skyrocket once we started using enriched data for targeting. It’s like going from shouting into the void to having a personal conversation with each customer. And as any good marketer would know, personalization begins at targeting which you can only achieve with complete customer information.
6. Risk Management
This one’s huge. Enriched data helps you spot potential issues before they become real problems. With the right insights, you can proactively address risks, whether they’re related to customer satisfaction, supply chain disruptions, or market shifts.
What are Data Enrichment Techniques?
Alight, let’s dive straight into common data enrichment techniques and data enrichment strategies!
1. Appending Data: Filling in the Blanks
Data appending – it’s like filling in the blanks on your data sheet.
Basically, it’s adding missing info to your existing records. There are two main types:
- Internal appending: Using data you already have somewhere in your org. I once discovered our sales team had a goldmine of info our marketing folks didn’t know about. Bringing those together proved to be a complete game-changer.
- External appending: Bringing in data from outside sources. Super powerful, but be careful because not every data source is reliable. While selecting one, you need to prioritize those with a solid reputation and compliance with data protection regulations.
Here are some quick tips to pick good data sources:
- Check their reputation
- Look for regularly updated data
- Ask for a sample before buying
- Make sure they follow data protection laws
How to use it?
Append your data to create detailed customer profiles, improve lead quality, and ultimately come up with with more informed business strategies.
2. Segmentation: Divide and Conquer
Looking at your data piled up can be scary, you need manageable chunks to focus on. Instead of shooting in the dark, you need to look at specific segments for an X-ray vision into your customer base.

Types of Segmentation
Now, there are a few main types of segmentation:
- Demographic: This is the basic stuff – age, gender, income, that kind of thing. It’s a good starting point, but don’t stop here.
- Behavioral: This is where it gets juicy. You’re looking at how people actually behave – what they buy, how often, their browsing habits. I once uncovered a whole new target market just by digging into our behavioral data.
- Psychographic: This is the deep stuff – values, attitudes, interests. It’s trickier to nail down but when you get it right, it’s gold.
Principles of Segmentation
When it comes to actually doing the segmentation, there are a few principles I’ve found super helpful:
- Start with a clear goal. Don’t just segment for the sake of it.
- Use the right tools. There’s some great software out there that can make this way easier.
- Don’t go overboard with too many segments. I made that mistake once and ended up more confused than when I started!
- Always, always test your segments. What looks good on paper might not work in practice.
How to use it?
Now, let’s talk applications. Segmentation, as a data enrichment method, can help multiple teams:
- Tailoring marketing outreach and follow-ups sent our engagement rates through the roof!
- Customer service teams can start routing calls based on customer segments for high satisfaction scores.
- Segmentation also helps you spot gaps in the market that your competitors are missing. We used the insights from our segmented data to launch a whole new product line.
Look, at the end of the day, segmentation isn’t just about organizing your data. It’s about understanding your audience on a deeper level.
3. Derived Attributes: Unlocking Hidden Insights
Derived attributes are like secret weapons in your data arsenal. Basically, you’re taking the info you already have and using it to create brand new data points. It’s like turning lead into gold!
I remember when I first stumbled onto this concept. We had all this customer data sitting around, but we weren’t really using it to its full potential. Then we started playing around with derived attributes, and boom! Suddenly we were seeing our customers in a whole new light.
Some common derived attributes that have been game-changers for me:
- Lifetime Value: Instead of just looking at what a customer spent last month, we could predict how much they might spend over their entire relationship with us. Talk about a perspective shift!
- Engagement Scores: We created this by combining things like website visits, email opens, and purchase frequency. It gave us a quick way to spot our most active customers.
- Risk Factors: This was a lifesaver for our finance team. By combining payment history, credit score, and a few other factors, we could predict which accounts might default oe churn over time.
The real magic happens when you start using these derived attributes in your models and decision-making processes. Our predictive models got so much more data accuracy once we started feeding them these new data points.
For example, we used to struggle with customer churn. But once we started incorporating engagement scores and lifetime value into our models, we could spot at-risk customers way earlier.
But, step with caution! It’s really easy to lose sight of what is important as you chase so many derived attributes. It’s always better to focus on quality, not quantity.
4. Imputation: Dealing with Missing Data
Alright, let’s tackle imputation—the art of dealing with those missing data points.
Missing data can seriously mess up your analysis if you’re not careful. I remember this one time, we were doing a big outreach campaign, and about 20% were bounced. Talk about a headache!
So, what’s a data nerd to do? Enter imputation. It’s basically educated guesswork to fill in those blanks, but you need to do it right!
Main Types of Imputation
- Mean Imputation: This method fills in missing values with the average of the available data.
- Median Imputation: Similar to mean, but uses the middle value instead. This can be better if you’ve got some outliers skewing your data.
- Regression Imputation: This is where it gets fancy. You use other variables to predict the missing values. It’s like playing detective with your data.
- Multiple Imputation: The gold standard, if you ask me. It creates multiple plausible datasets and combines them. It’s more work, but way more accurate.
Now, when should you use these techniques? Well, it depends. If you’re missing just a tiny bit of data, imputation can be a lifesaver. But if you’re missing huge chunks? You might be better off just excluding those records entirely.
Best Practices of Imputation
- Always, always document your imputation process. Future you (or your teammates) will thank you.
- Use multiple imputation methods and compare results. If they’re wildly different, that’s a red flag.
- Consider the nature of your missing data. Is it random, or is there a pattern? This can affect which method you should use.
- Don’t forget to flag imputed values in your dataset. It’s important to know which data points are real and which are estimated.
- When in doubt, consult a statistician. Sometimes, it’s worth bringing in the big guns.
The most important thing? Don’t let perfect be the enemy of good. Yeah, imputation isn’t perfect, but neither is throwing out a bunch of potentially valuable data. Strive to find a middle point that works for you.
5. Entity Extraction: Making Sense of Unstructured Data
So, what is entity extraction? Simply put, it’s pulling out specific pieces of information from unstructured data—think names, places, dates, or even more complex stuff like sentiment or intent. And let me tell you, it’s crucial in today’s data-heavy world.
I remember when I first stumbled onto this concept. We had mountains of customer feedback—emails, social media posts, call transcripts—but no easy way to analyze it all. It was like trying to find a needle in a haystack… blindfolded!
There are a bunch of techniques for extracting entities, depending on what kind of data you’re dealing with:
- For text, we use things like named entity recognition (NER) and part-of-speech tagging. It’s like teaching a computer to read like a human.
- With images, it gets trickier. We use computer vision techniques to identify objects, faces, or text within the image.
- Audio? That’s where speech recognition comes in. We convert speech to text and then apply text-based techniques.
Now, machine learning and natural language processing (NLP) have really upped the game here. We’re talking about algorithms that can learn to recognize entities without being explicitly programmed. It’s pretty mind-blowing stuff.
I’ve seen this applied in so many cool ways:
- Content analysis: We used it to automatically tag and categorize thousands of articles.
- Customer feedback: Instead of reading through endless comments, we could instantly pull out key issues and sentiments.
- Competitive intelligence: We set it loose on our competitors’ websites and social media. The insights we got were gold.
But here’s the thing—it’s not perfect. I’ve had my fair share of facepalm moments when the system misidentified entities. Like the time it thought every mention of “apple” was about the tech company. Spoiler alert: sometimes people just talk about fruit!
The key is to always, always have human oversight. These tools are amazing, but they’re not replacements for good old-fashioned human judgment.
6. Categorization: Bringing Order to Chaos
Let’s talk about data categorization—the unsung hero of making sense out of data chaos.
Why’s categorization such a big deal? Well, imagine trying to find a book in a library with no shelves or sections. Nightmare, right? That’s what uncategorized data feels like.
Now, there are two main ways to tackle this beast:
- Manual categorization: This is the old-school way. Humans go through and sort everything by hand. It’s precise but slow as molasses. We tried this at first and… yeah, let’s just say it wasn’t our finest hour.
- Automated categorization: This is where machines do the heavy lifting. It’s faster, but it can sometimes miss nuances. We use this now, and while it’s not perfect, it’s a huge time-saver.
When it comes to structure, you’ve got two main flavors:
- Hierarchical: Think of it like a family tree. Organizes categories in a nested format, and it is suitable for complex datasets.
- Flat: More like tags. Each item can belong to multiple categories. It’s simpler but can get messy with lots of overlapping categories.
We’ve used categorization in a bunch of ways:
- Product classification: We went from a jumbled mess of inventory to a neatly organized catalog.
- Content tagging: This was a game-changer for our blog. Suddenly, related articles were actually, you know, related.
- Expense management: Categorizing expenses helped us spot areas where we were bleeding money.
Here’s the thing though—categorization isn’t a “set it and forget it” deal. You have to keep refining your categories as your data evolves—ongoing data management. We learned this the hard way when our original categories became outdated, and we ended up with a ton of stuff in the “miscellaneous” bucket.
Wrapping Up and My Experience With Data Enrichment
Wow, what a journey through the world of data enrichment! We’ve covered everything from appending and segmentation to the cutting-edge realms of entity extraction and AI-powered categorization.
By mastering these techniques and data enrichment processes, you’re now equipped to transform your data into a goldmine of insights.
Remember, the key to success lies in choosing the right combination of techniques that align with your specific needs and goals. So, what are you waiting for?
It’s time to roll up your sleeves, dive into your data, and watch your data quality soar to new heights in 2024. Your business (and your bottom line) will thank you!


![What is Account Based Marketing? [8-Step Guide to Get Started]](https://janabhau.com/wp-content/uploads/2024/09/Featured-Images-4-768x432.png)
![How to Craft an Effective Prospecting List in 2024 [+Template]](https://janabhau.com/wp-content/uploads/2024/04/Screenshot-2024-04-14-at-16.25.44-768x433.png)